 |
|
| The following gallery of graphs demonstrate the care GrafEq takes while producing graphs. Interested GrafEq users can generate portions of the graphs at any resolution using GrafEq. We invite users of other graphing packages to try some of the graphs as well... | ||||
|
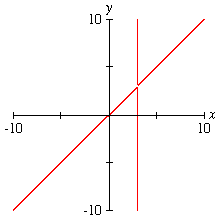
Spike This demonstrates a shortcoming of any simple sampling method. The abrupt vertical asymptote in the graph is missed by many graphing programs, although zooming into the asymptote will reveal it. (But you have to know it is there first!) |
|
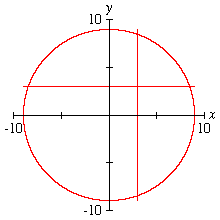
Circular Spike Similar to Spike, but more convincing for some, since there is a natural view which causes problems for many graphing techniques. Zooming into an “asymptote” will cause other details to leave the view. |
|
|
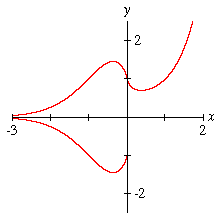
Densely (un)Defined Function A graph of the function xx; although the graph does not immediately appear to be a function, closer examination will reveal its true nature. Most graphing programs do not define the exponential function for negative bases. |
|
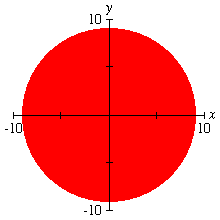
Solid Disc This graph demonstrates how to convert an implicit relation into an equivalent implicit equation. Common belief that “equation = line-like, inequality = area-like” is refuted by this graph. Many graphing programs base their techniques on this erroneous common belief. |
|
|
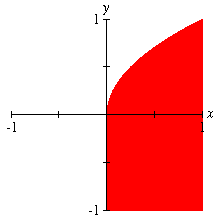
Partial Inequality Correct graphs of inequalities involving partial functions are likely only if partial functions are carefully handled. A graph of the area beneath the square root is shown here. |
|
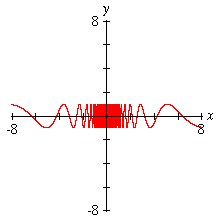
Infinite Frequency A common graph, of interest to students of introductory calculus. Not as difficult to handle as Spike, since its change in frequency is smooth—yet many graphing programs still generate misleading graphs for this function. |
|
|
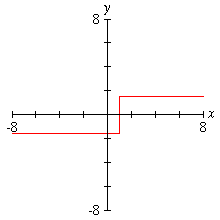
Smooth Step Here is a graph of a continuous function that approximates a step function. Programs that can draw discontinuous functions might misclassify (and thereby misdraw) this sort of function. |
|
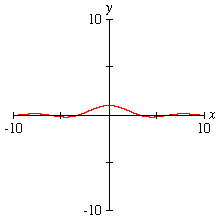
Wave The function (sinx)/x can be problematic for some graphing techniques for x near zero. A GrafEq graph of y=(sinx)/x is shown. |
|
| Any other troublesome graphs out there? We would be glad to try out and put up here, even if GrafEq graphs them incorrectly. There are graphs that GrafEq has trouble with—can you find them? | ||||