A Student Assignment
For the following system:


- determine the coordinates of all simultaneous solutions,
- determine the maximum distance between such solutions,
- estimate the slopes of the asymptotes, and
- submit an accurate drawing of the system.
Solution, using GrafEq:
- Launch GrafEq
by double-clicking its icon.
Click on the title screen to remove it.
- Enter the first relation above.
Use the up key for the exponent and the slash (/) key for division.
- Press Return to open a Create View window.
- The default bounds (-10 to 10) are probably fine, so click on the Create button or
press Return (which is equivalent to clicking on an outlined button).
- Once the plotting is finished, your view window will appear as below:
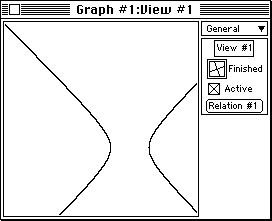
Figure 1: a single relation, a hyperbola.
- Under Graph, select New Relation by dragging and releasing the mouse.
- Enter the second relation and then activate it by either
pressing Return or clicking on the Active box. Your view
window will show both relations. (See figure 2.)

Figure 2: a simultaneous system, a hyperbola and an ellipse.
- Press T to access the ticks side-bar and then click on its
active box to display ticked axes. There are obviously simultaneous
solutions in quadrants II, III and IV.
- Press Z to access the zoom side-bar. Ensure that the Keep this view
box is not checked. Position the cursor over the quadrant II solution,
shrink the cursor box with the arrow keys and then option-click to zoom
in to a View #2 window. Since you option-clicked, the View #1 window
is retained—for subsequent access to the other solutions.
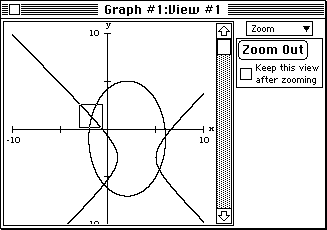
Figure 3a: simultaneous system with zoom box positioned over a common point.
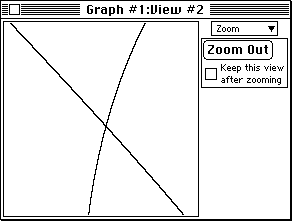
Figure 3b: the view produced by zooming in.
- Press 1 to access the one point side-bar and then place the
cross hair cursor accurately on the intersection of the curves.
The coordinates can be read from the side-bar. For better precision
you may wish to zoom further in to this solution. If so, repeat
from steps 9 and 10 on the second view but simply click—rather than
option-click when zooming—since you will not wish to retain views.
Once you are satisfied with the precision of the quadrant II solution,
close all view windows except that for the first view, and repeat steps 9 and 10
for the other three solutions.
- To determine the maximum distance separating solutions, first ensure
that View #1 is active (foremost) and press 2 to access the two
point side-bar. Place the cursor over one solution and press A,
then over another solution and press B. The length of segment AB can
be read directly from the side-bar (d, under Distance). The solutions
furthest apart are as in figure 4a below.
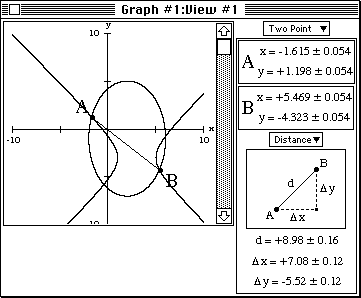
Figure 4a: a segment AB that connects two solutions.
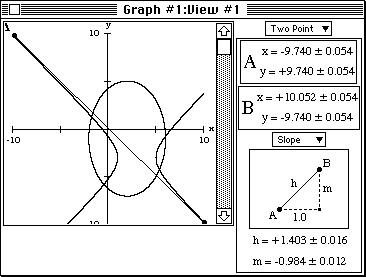
Figure 4b: a segment AB that approximates an asymptote.
- To approximate an asymptote, place A and B as far apart as possible
as shown in figure 4b and select the slope mode in the side-bar.
In this case the slope is near -1. By symmetry, the other asymptote
will have slope 1. To confirm these values you can zoom out and
re-evaluate the slope from points further apart.
- To copy the graph accurately to paper:
- Ensure that View #1 is foremost and press T to access the ticks side-bar.
- Click on the lowest button in the simple display (dense ticks with crosses)
and ensure the active box is checked.
- You can now accurately copy the curves to graph paper.
You can now terminate the
GrafEq session by selecting Close Graph and then
Quit under File.
Note for the teacher:
The foregoing steps illustrate the graphics-based
techniques appropriate to the modern secondary mathematics curriculum.
An alternative method for determining the four solutions of the above system
is as follows:
- Enter both equations as separate constraints of a single relation as shown
in figure 5a and plot this relation directly as shown in figure 5b.
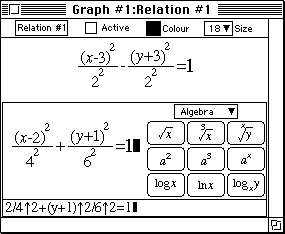
Figure 5a: a single relation defined by two constraints.

Figure 5b: solutions determined by plotting the formula of figure 5a.
The coordinates of these solutions can be determined as in steps 9 and 10 above.
|


