Slope-Intercept Form
- Launch GrafEq
by double clicking its icon. Click on the title screen to remove it.
- Type in the equation
y=Mx+B.
- Press the Tab key, and assign a value to M by typing
“M=1”.
- Press the Tab key again, and assign a value to B by typing
“B=0”.
The input window is now complete.

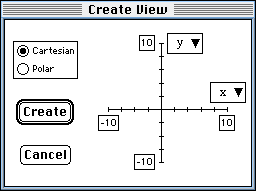
- Press the Return key to get the
Create View window.
 The default mode (Cartesian) is correct,
and the default bounds (-10 to 10) are fine for both
x-axis and y-axis.
- Click on the Create button.
GrafEq will plot the graph
of y=1*x+0.

- The side-bar is currently showing general information.
To display ticked axes:
- click on the General button and drag the highlight bar to
Ticks;
- under the Simple submenu, click on the box with dense
ticks and crosses;
- click the Active checkbox to display the ticks and crosses.

- Now, copy the graph onto the coordinate system graph paper.
Label it “y=1*x+0”.
Make a dot where the line crosses the y-axis
and label it “0”.
This point is called the y-intercept and its y-value is 0.
- Next, change the value of B from 0 to -3:
- click on the Ticks button and drag the highlight bar to
General;
- click on the Relation #1 button to display the relation entered;
- click on the B=0 constraint, and change 0 to -3.
- Repeat the necessary steps, as described above, to plot
y=1*x+(-3).
Label the new line on your graph paper as “y=x-3”.
Q: What is the y-intercept of this line?
Label the point where the line crosses the y-axis as “-3”.
- Repeat the necessary steps for
B=5.
Q: What is the y-intercept of this line?
Q: How should you label the y-intercept accordingly?
- Q: Where will the line with equation
y=x+7 cross the y-axis?
Confirm your answer with GrafEq,
by graphing y=x+7
(by setting B=7).
- Q: Where do you think the graph of y=2x+5
will cross the y-axis?
Confirm your answer with GrafEq, setting
M=2 and B=5.
- Now, in relation #1, set
M=-4 and
B=5.
- Under the Graph menu,
choose New Relation to get the
Graph #1 Relation #2 input window.
- Enter the equation
y=0.2x+5.
Press the Return key to see both
Relation #2 and Relation #1 on Graph #1.
- Repeat the necessary steps for the equation
y=3x+5.
- Q: What do the three lines have in common? Why?
Conclusion:
The graph of y=Mx+B is a line with y-intercept = _____________.
|
|

